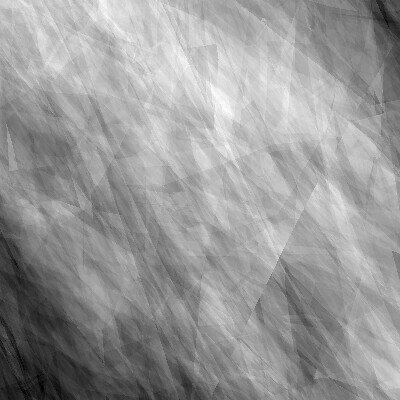
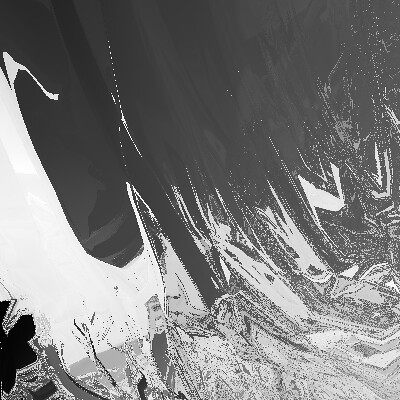
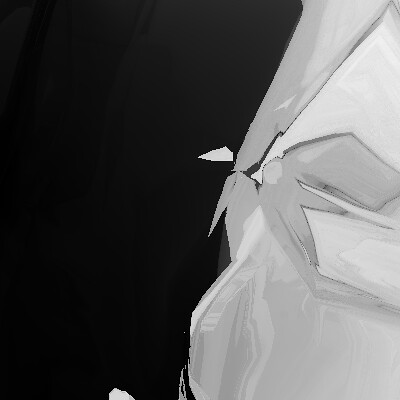
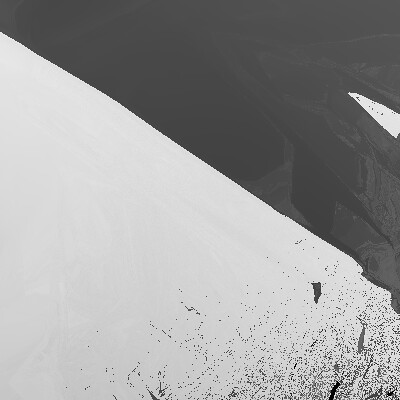
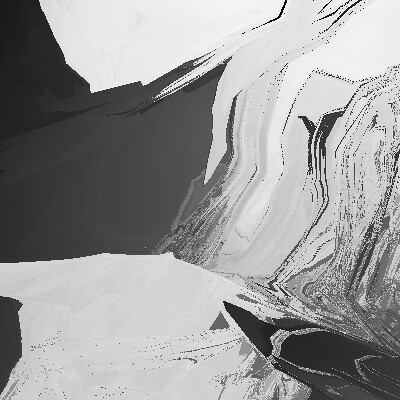
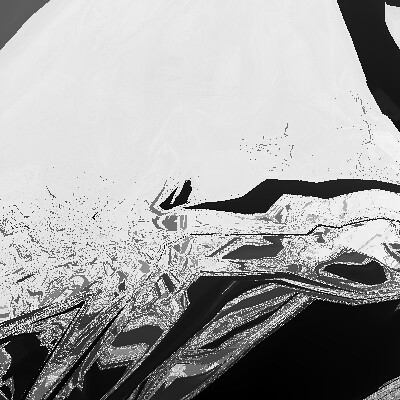
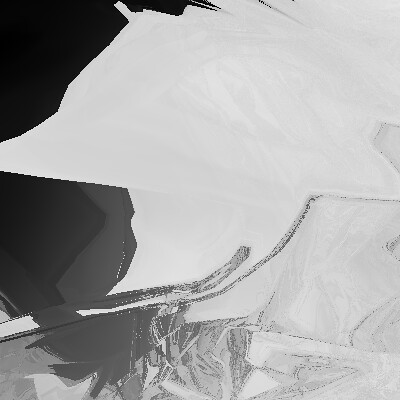
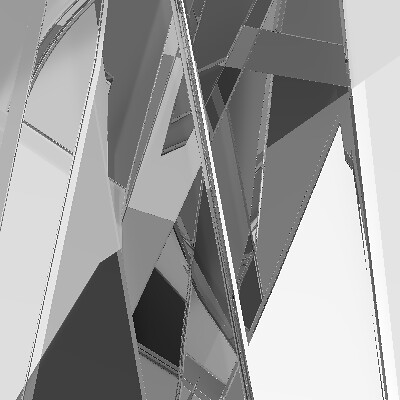
In some recent experiments, I've found some nice ways of visualizing the geometry of actual fitness landscapes. I produced the images below by evolving recurrent neural networks to optimize performance on various tasks (e.g. wandering through a virtual maze), and then examining the resulting fitness values of a large number of very nearby points to those evolved solutions. Of course it is impossible to visualize the entire space, because of the high dimensionality; so instead what we are looking at are randomly selected 2D slices through that space. The shading is representative of numeric fitness (dark = low-fitness, light = high-fitness).
Here are a few examples of the results: